Data highlight
December 1, 2021
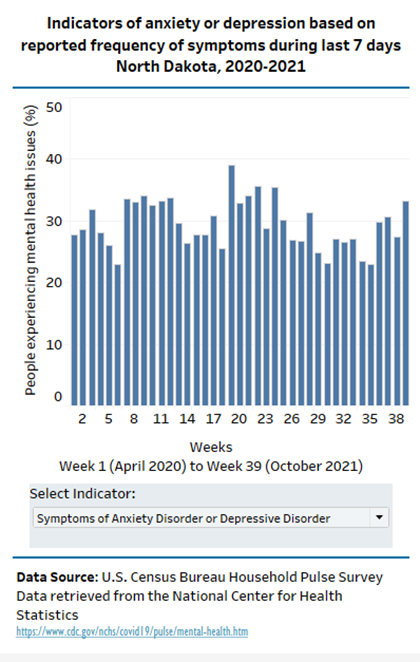
North Dakotans experience increased mental distress during the pandemic
The COVID-19 pandemic has negatively affected many people’s mental health and created new barriers for people already suffering from mental illness.
For many years, the National Center for Health Statistics has conducted a yearly National Health Interview Survey to monitor the health of the nation. The survey contains a number of questions that ask about symptoms of mental distress and help monitor the mental health of U.S. adults. Since the beginning of the pandemic, slightly modified questions were asked in the U.S. Census Household Pulse Survey(1). The modified questions collect data on symptoms over the last 7 days, rather than the typical 14 days of the National Health survey. Using pre-pandemic data as a baseline, newly obtained data help monitor the impact of the pandemic on mental health. Before the pandemic, in 2019, one in ten U.S. adults (11%) reported symptoms of anxiety or depressive disorder (2). During the pandemic, that percentage tripled, with almost four in ten U.S. adults (36%) reporting symptoms of anxiety or depression disorder.
In North Dakota, on average, three in ten adults (29%) reported symptoms of anxiety or depressive disorder during the pandemic. The percentage of people who report symptoms of anxiety or depressive disorder varied during the pandemic, generally following the waves of the pandemic, with the lowest percentage being reported in June 2020 and August 2021 (23%, each) to the highest of 39 percent in November 2020. Recently, during the fourth wave of the pandemic, the percentage of people reporting symptoms of anxiety or depression disorder are on the rise again reaching 33 percent at the beginning of October 2021.
The percentage of people reporting only symptoms of anxiety disorder, also varied in North Dakota from the lowest of 18 percent in May 2020 to the highest of 33 percent in November 2020. The most recent data in October 2021 shows 29 percent of adults reporting symptoms of anxiety disorder. Additionally, the percentage of people reporting only symptoms of depressive disorder, varied in North Dakota from the lowest of 13 percent in August 2020 to the highest of 27 percent in both July 2020 and in January 2021. In October 2021, 24 percent of adults reported symptoms of depressive disorder.
Notes:
Click here or on the picture for an interactive view. Hover over the chart bars for more detail.
Data source: Centers for Disease Control and Prevention (CDC), National Center for Health Statistics, Anxiety and depression
(1)The Household Pulse Survey is an ongoing survey designed for quick and efficient deployment of data regarding household experiences during the pandemic.
(2)Estimates of symptoms of an anxiety disorder are based on the first two questions of the seven-item Generalized Anxiety Disorder (GAD-2) scale where respondents are asked how often, in the last 7 days, they have been bothered by 1) feeling nervous, anxious, or on edge, and 2) not being able to stop or control worrying. Estimates of symptoms of a depressive disorder are based on the first two questions of the eight-item Patient Health Questionnaire (PHQ-2) scale, where respondents are asked about how often, in the last 7 days, they have been bothered by 1) having little interest or pleasure in doing things, and 2) feeling down, depressed, or hopeless.
For both scales, answers are assigned a numerical value: not at all = 0, several days = 1, more than half the days = 2, and nearly every day = 3. The two corresponding responses for each scale are added together. Estimates of symptoms of an anxiety/depressive disorder include adults who had reported symptoms of anxiety/depression that resulted in scale scores equal to three or greater. These adults have symptoms that generally occur more than half the days or nearly every day.
VIEW TOPIC: HEALTH / MENTAL HEALTH
November 1, 2021
North Dakota’s urban cities account for most of the state’s population growth in the past decade.
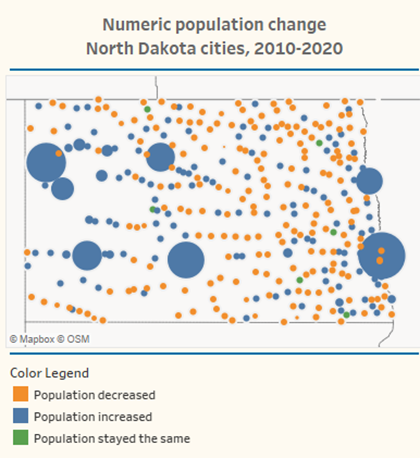
North Dakota has 357 incorporated places. There is no minimum population for incorporation in North Dakota; therefore, all these places are considered cities. In 2020, these cities accounted for 603,660 of North Dakota’s 779,094 residents.
According to the 2020 Census, only one city (Fargo) has a population over 100,000 (125,990 people); three cities (Fargo, Bismarck, and Grand Forks) have more than 50,000 people, and nine cities have a population over 10,000. Conversely, 13 cities have a population of 10 or less, 79 cities have 50 people or less, and 140 cities have 100 people or less. A large majority of North Dakota cities (87%) have 1,000 people or less. The smallest city in North Dakota is Ruso, with a 2020 population of one.
From 2010 to 2020, 146 North Dakota cities increased their population, six cities stayed the same, and 205 cities saw a decrease in population. Fargo gained the most people (20,441), increasing its population from 105,549 in 2010 to 125,990 in 2020. Rugby lost the most people (367), from 2,876 in 2010 to 2,509 in 2020.
Overall, the population of the 357 incorporated cities increased by 97,249 people from 2010 to 2020. Combined, the urban cities (Fargo, West Fargo, Bismarck, Mandan, Grand Forks, Dickinson, Minot, Jamestown, Wahpeton, and Williston) accounted for 91 percent of this growth and for 83 percent of the state’s total population growth.
Percentage wise, compared to 2010, Watford City increased its population by more of three and a half times, from 1,744 in 2010 to 6,207 in 2020. Two other cities more than doubled their population: Arnegard from 115 in 2010 to 282 in 2020 and Venturia from 10 in 2010 to 21 in 2020. Williston, almost doubled its population (98% increase), from 14,716 in 2010 to 29,160 in 2020.
Notes:
Urban cities are defined as the major cities in metropolitan and micropolitan statistical areas.
Click on the picture for an interactive view.
VIEW TOPIC: DEMOGRAPHICS / POPULATION-CITIES
October 1, 2021
Racial and ethnic diversity in North Dakota nearly doubled since 2010.
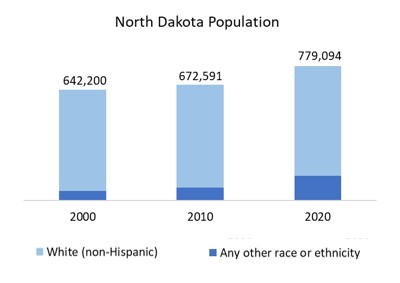
Racial and ethnic diversity in North Dakota increased greatly in the past twenty years, from 8 percent in 2000 and 11 percent in 2010 to 18 percent of the total population in 2020. Compared to 2010, North Dakota’s racial and ethnic population other than White, non-Hispanic almost doubled, from 74,584 people in 2010 to 142,934 people in 2020 (92% increase).
In a recent analysis, the U.S. Census Bureau, in order to better measure racial and ethnic diversity, calculated a Diversity Index that measures, in percentages, the probability that two people chosen at random will be from different race and ethnicity groups. Nationally, the Diversity Index increased from 55 percent in 2010 to 61 percent in 2020. For North Dakota, the Diversity Index increased from 21 percent in 2010 to 33 percent in 2020 (i.e., in 2020 there was a 33% chance that two people chosen at random in North Dakota were from different racial and ethnic groups). Counties with the largest Diversity Index in 2020 are Mountrail (59%), Benson (53%), and McKenzie (48%). Conversely, counties with the lowest Diversity Index in 2020 are Slope (7%), Emmons (8%), and Steele (8%). Counties with the largest increase of the Diversity Index, from 2010 to 2020, are Williams (from 17% to 42%), Stark (from 11% to 29%), and Cass (from 18% to 34%).
Even with these changes, it is important to note that North Dakota is less racially and ethnically diverse than most states (44th out of 50 states in 2020), with 18 percent of the population being of a race and ethnicity other than White, non-Hispanic (i.e., American Indian, Black, Asian, two or more races, some other race, and Hispanic origin regardless of race).
Check also U.S. Census Bureau Data Visualization on racial and ethnic diversity in the U.S.
VIEW TOPIC: DEMOGRAPHICS / RACE
September 1, 2021
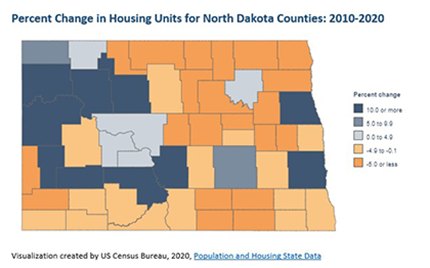
Two North Dakota counties lead all U.S. counties for the largest percentage increase in housing units from 2010 to 2020.
In addition to counting the number of people living in the United States, the decennial census also counts the number of housing units. The Census Bureau defines a housing unit as “a house, an apartment, a mobile home, a group of rooms or a single room that is occupied (or, if vacant, intended for occupancy). Both occupied and vacant housing units are included in the housing unit inventory. Boats, recreational vehicles (RVs), vans, tents, railroad cars, and the like are included only if they are occupied as someone's current place of residence”.
The total number of housing units in North Dakota grew by 17 percent from 2010 to 2020. For comparison, the number of housing units in the United States grew by 7 percent during the same time period. Among the 50 states, North Dakota had the second highest housing unit growth, after Utah (18% growth). In terms of absolute numbers, Texas had the largest increase in the number of housing units; however, North Dakota surpassed Texas in percentage increase.
Two North Dakota counties were the fastest growing counties in the U.S. in terms of housing unit growth. McKenzie County was the only county in the U.S. to more than double its total count of housing units between the 2010 and 2020 (148% increase). Williams County also almost doubled its housing units (93% increase).
However, even though two of North Dakota’s counties lead the nation in percentage growth of housing units at the county level from 2010 to 2020, the number of housing units decreased in 32 North Dakota counties and stayed about the same in 5 counties.The 2020 Census housing unit counts provide the foundation for the Census Bureau’s American Community Survey and the American Housing Survey, which will provide additional details about the U.S. housing stock.
Read more on the growth of the U.S. housing stock in the last decade
VIEW TOPIC: HOUSING
August 1, 2021
Change in the children and youth population in North Dakota counties has not been consistent across the state.
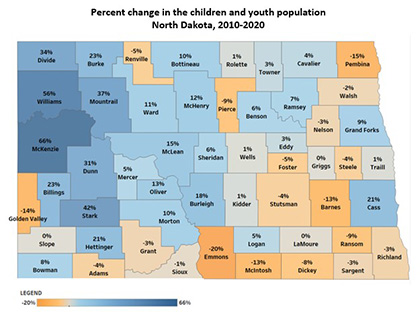
After decades of decline, the number of children and youth (under 18 years old) has continued to grow in North Dakota since 2010. Although the growth rate started to slow in 2016, the number of children and youth increased by 31,758 from 2010 to 2020, reaching a population of 181,629 in 2020*. In 2020, children and youth comprised 24 percent of the total population in North Dakota, a slight increase from 22 percent in 2010.
Overall, the children and youth population in North Dakota increased 21 percent from 2010 to 2020. However, this increase has not been consistent across the state. Counties in western North Dakota experienced the largest increase, from over 30 percent in Dunn County to 66 percent in McKenzie County. Metropolitan counties also saw an increase of the children and youth population from 9 percent in Grand Forks County to 21 percent in Cass County. Conversely, 18 counties experienced a decrease in the children and youth population from 2010 to 2020, with the largest decrease of 20 percent in Emmons County.
*According to the 2020 Population Estimates Program
VIEW TOPIC:CHILDREN & YOUTH / POPULATION TRENDS
JUly 1, 2021
Most industries lost jobs in 2020 in North Dakota.
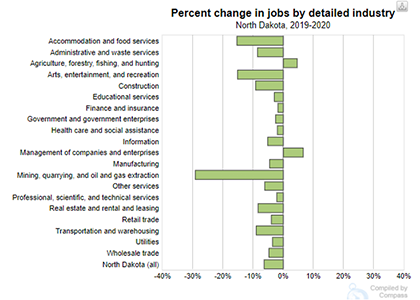
The COVID-19 pandemic has had a great impact on the United States job market. From 2019 to 2020, all states suffered a decline in the number of jobs. In 2020, North Dakota overall lost 26,784 jobs, a 6.3 percent decline compared to the previous year. The Mining, Quarrying, and Oil and Gas Extraction industry lost 6,226 jobs, a 29 percent decrease from the previous year, which is the largest percentage decrease of all industries. Accommodation and Food Services lost 5,339 jobs, a 15 percent decrease, and Construction jobs declined by 2,584 jobs as compared to the previous year, a 9 percent decrease. Only two industries reported job gain from 2019 to 2020: Management of Companies and Enterprises gained 240 jobs and Agriculture, Forestry, Fishing and Hunting gained 211 jobs (7% increase and 5% increase, respectively).
At the county level, Emmons is the only county reporting an employment increase from 2019 to 2020 (10 jobs or 1 percent increase), all other counties lost jobs during this time period. Williams County lost the largest number of jobs (5,393 or 18 percent) and McKenzie County lost the largest percentage of jobs (20 percent or 2,442 jobs) from 2019 to 2020.
JUNE 1, 2021
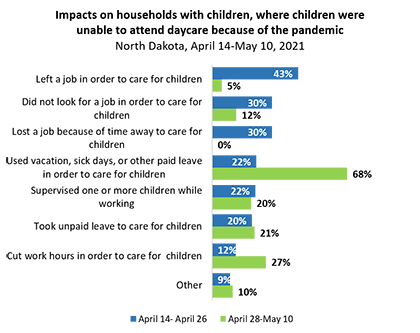
The pandemic is still posing challenges to childcare arrangements.
The COVID-19 pandemic created many challenges to families with children regarding childcare arrangements, as parents were faced with childcare provider closures, stay-at-home orders, school closures or online learning, work-related issues, and health and safety concerns. Due to the long-lasting effects of the pandemic, parents had to continually adjust their work and childcare arrangements by finding temporary or more permanent solutions.
Recently (starting with April 14, 2021), the U.S. Census Bureau Household Pulse Survey added additional questions to observe the impact of Covid-19 on families with children regarding childcare arrangements. According to data collected April 14 - May 10, 2021, out of adults in households with children, 7 percent from the April 14 to April 26 timeframe, and 5 percent from April 28 to May 10, reported that their children were unable to attend daycare or another childcare arrangement (e.g., before and after school care), in the past four weeks, because of the coronavirus pandemic.
After more than one year, the pandemic is still posing challenges to childcare arrangements, forcing parents to balance childcare and work and adapt to ever changing situations. In late April, most adults in households with children where children were unable to attend childcare because of the pandemic left a job in order to take care of children (43%), lost a job because of the time away to care for children (30%), and did not look for a job in order to take care for children (30%). In early May, most adults in households with children where children were unable to attend childcare because of the pandemic used vacation, sick days, or other paid leave to care for children (68%) or cut work hours in order to take care of children (27%).
Beyond childcare arrangement impacts, households with children experienced many other impacts during the pandemic like loss of employment income, food insufficiency, housing insecurity, and mental health issues. Explore the dashboard for more detail.
VIEW TOPIC: Impact of COVID-19 on North Dakota Households with Children Dashboard
May 1, 2021
About half of North Dakota adults received at least one dose of the COVID-19 vaccine as of end-April, but one-fourth of adults are hesitant to receive the vaccine.
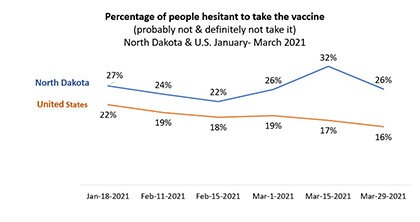
According to the North Dakota Department of Health COVID-19 Vaccine Dashboard, 47 percent of North Dakota’s adults received at least one dose of a COVID-19 vaccine as of April 30, 2021. However, not everyone who is eligible for a vaccine is ready to take it. New data collected by the U.S. Census Household Pulse Survey starting with January 2021, provides some information about those hesitant to take the vaccine and the reasons behind that.
The percentage of adults (age 18 and older) in North Dakota who answered that they probably or they definitely won’t take a COVID-19 vaccine has trended above the U.S. for all reporting periods (every two weeks starting with January 2021). As of end of March 2021, one-fourth of adults in North Dakota are hesitant to receive the COVID-19 vaccine (26 percent).
While in the U.S. the percentage of people hesitant to take a COVID-19 vaccine decreased week after week, in North Dakota, after decreasing from mid-January to mid-February, the rate saw an increase from 22 percent in mid-February to 32 percent in mid-March. The main reasons for vaccine hesitancy in North Dakota are related to vaccine safety (i.e., concerned about possible side effects, wait to see if it is safe, don’t trust COVID-19 vaccines).
For more detailed information about this topic, see the U.S. Census Household Pulse Survey and their new COVID-19 Vaccination Tracker. Find more COVID-19 data resources on North Dakota Compass.
VIEW TOPIC: COVID-19 Data Resources
April 1, 2021
Jobs in industries closely tied to the oil and gas sector followed similar patterns of growth and decline in North Dakota.
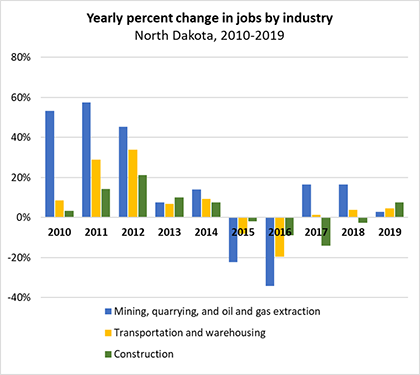
The Mining, quarrying, and oil and gas extraction industry experienced tremendous growth in the number of jobs at the beginning of the oil boom period (53% from 2009 to 2010, 58% from 2010 to 2011, and 45% from 2011 to 2012). While the growth slowed down, the industry continued to add jobs in 2013 and 2014. However, due to low oil prices and the decline in oil and gas production, the industry lost 22 percent of jobs in 2015 and 34 percent in 2016. As oil prices rose, the industry added 17 percent of jobs in 2017, 17 percent of jobs in 2018, and most recent data show a 3 percent addition in 2019.
Other industries closely tied to the oil and gas sector followed similar patterns of growth and decline in the number of jobs. Transportation is crucial for the mining industry as most materials and final products are transported by truck. After gaining jobs through 2014 and losing jobs in 2015 and 2016, the Transportation and warehousing industry added 1 percent of jobs in 2017, 4 percent of jobs in 2018, and 5 percent in 2019.
The Construction industry is also closely tied to oil and gas economic activity by creating the needed infrastructure and by supporting the needs of a growing population in the impacted areas. The Construction industry followed similar trends of growth and decline in jobs from 2010 to 2016. However, unlike the Mining and Transportation industries, the Construction industry continued to lose jobs in 2017 and 2018, but started recovery in 2019.
However, as the global pandemic has had a significant impact on all economic sectors, especially on the oil and gas industry, the job growth and/or loss situation may look very different in 2020.
March 1, 2021
The pandemic led to unmet needs for medical care.
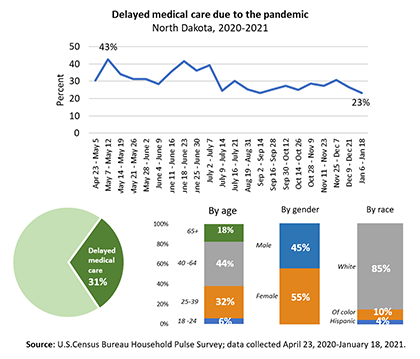
Reduced access to medical care is a serious impact of the pandemic since delaying medical care can result in health complications and even death. In general, people may delay needed medical care due to cost. As a result of the pandemic however, people delayed getting medical care or were unable to get the care they needed due to cancelled appointments or procedures, reduced transportation options, fear of going to the hospital and risk infection, or the desire to not be a burden on the health system, among other reasons1.
In North Dakota, the highest percentage of adults who delayed medical care because of COVID-19 was reported at the beginning of May 2020 (43%), with a couple of other peaks during the month of June 2020. Mid-January 2021, 23 percent of adults reported to delay medical care because of the pandemic1.
On average, nearly one-third (31%) of adults delayed getting medical care because of the COVID-19 pandemic from April 2020 to January 18, 2021. Almost half of adults who delayed medical care were 40 to 64 years old (44%) and one-third were 25 to 39 years old (32%). These two population groups are overrepresented among those who delayed medical care; the 40 to 64 years old represent 28 percent of North Dakota’s population and those 25 to 39 years old represent 26 percent of North Dakota’s population. Females are also overrepresented in the group of adults who delayed medical care (55 percent as compared to 49 percent in North Dakota’s population). Most of the adults who delayed medical care are white non-Hispanic, while 10 percent are of other races non-Hispanic, and 4 percent are Hispanic. This distribution reflects the distribution of population in North Dakota.
Note: Data is provided by the U.S. Census Bureau’s Household Pulse Survey, an ongoing survey to quickly provide data on how the COVID-19 pandemic has impacted American households on a range of issues.
February 1, 2021
Homeownership rate continued to decrease for all income groups in North Dakota from 2000 to 2019.
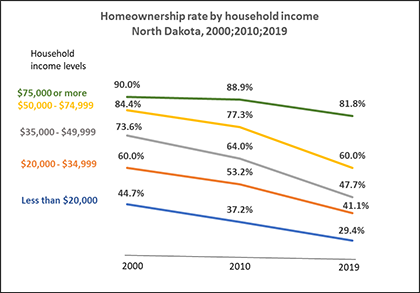
Homeownership is often used as an indicator of overall community prosperity and viewed as an important asset-building strategy for individuals. Owning a home provides an important source of stability for children and their families and is a measure of financial security. In addition to individuals, communities also benefit from high rates of homeownership. Residents who own their homes, in general, feel more rooted, take greater pride in the appearance of their homes, and have greater positive involvement with the community. However, access to homeownership depends on multiple factors such as availability of housing stock, housing affordability, and access to financing, in addition to personal preferences.
The overall homeownership rate in North Dakota decreased from 66.6 percent in 2000 and 66.9 percent in 2010 to 61.3 percent in 2019. Changes in the homeownership rate are partially attributed to changes in demographic characteristics of the population such as age, race and ethnicity, education, family status, and income.
In general, higher household incomes increase the likelihood to own a home. While the median household income* increased in North Dakota from $53,111 in 1999 to $64,577 in 2019, the homeownership rate decreased for each income group from 2000 to 2019. The largest decreases in homeownership were for householders with a household income from $35,000 to $49,999 and $50,000 to $74,000. Changes in government policy and housing market conditions and demographic characteristics potentially contributed to the decline of the homeownership rate for each income category and the increasing income disparity gaps in the homeownership rate.
This trend may be impacted in the near future by lower mortgage rates in 2020 and an increased interest in homeownership due to the pandemic.
*Median household income is adjusted for the effects of inflation or deflation (i.e., in 2019 dollars).
VIEW TOPIC: HOUSING / HOMEOWNERSHIP RATE
January 1, 2021
Voter turnout increased in 2020 in most North Dakota counties.
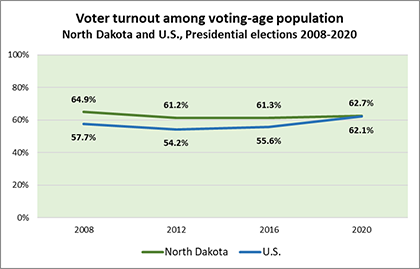
Voting is a right in a democracy. It offers people the means to elect representatives and to influence policy to best meet their needs, and those of their families and communities. Compared to the previous presidential election in 2016, all states increased their voter turnout. The U.S. voter turnout among the voting-age population increased from 55.6 percent in 2016 to 62.1 percent in 2020. Among the states, Hawaii, Utah, Montana, and California increased their voter-age turnout by 10 percentage points or more since the previous presidential election in 2016. In 2020, Minnesota had the highest voting-age turnout among the 50 states, at 75.3 percent.
North Dakota had a voter turnout of 62.7 percent in 2020, an increase from a turnout rate of 61.3 percent in 2016. Out of 581,379 North Dakota’s residents of voting age (age 18 and older), 364,251 voted in the 2020 November election.
Among North Dakota’s counties, Billings County had the highest voter turnout at 87.6 percent and saw the largest increase from 2016 (12.4 percentage points). Billings, Burke, Golden Valley, McHenry, McKenzie, Mercer and Stark Counties had an increase of 10 percentage points or higher as compared to 2016. The voter turnout in McIntosh, Cavalier, and Eddy Counties stayed about the same with an increase less than one percentage point. Rolette, Sioux, and Benson were the only counties who saw a decrease in voter turnout as compared to 2016.
Note:
Voting-age turnout is calculated by dividing the total number of voters (i.e., ballots cast) by the estimated voting-age population. The North Dakota Secretary of State retrieves voting-age population estimates from the Census Bureau for residents 18 years of age and older. Not all voting-age residents are eligible to vote; the estimated voting-age population may include immigrants without citizenship status, the prison population, and others ineligible to vote. Communities that have higher non-citizen and/or ineligible felon populations will therefore have lower voting-age turnout rates than other communities without these residents, even if the same percentage of eligible voters went to the polls.
VIEW TOPIC: CIVIC ENGAGEMENT / VOTER TURNOUT
Center for Social Research
North Dakota State University
Compass created by:
Wilder Research
© 2025. All rights reserved.